When it comes to project planning and management, there are various tools available to help organize tasks and visualize progress. But with so many options, how do you know which one is the right fit for your team? Understanding the main differences between Gantt charts, roadmaps, and story maps can be the key to choosing the most effective tool for your project management needs.
While Gantt charts, roadmaps, and story maps all serve the purpose of visually representing a project’s progression, they differ in their structure, level of detail, and intended use. This article aims to explore the main differences between these three project management tools, highlighting their strengths and helping you choose the most suitable option for your software project.
What is a Gantt Chart?
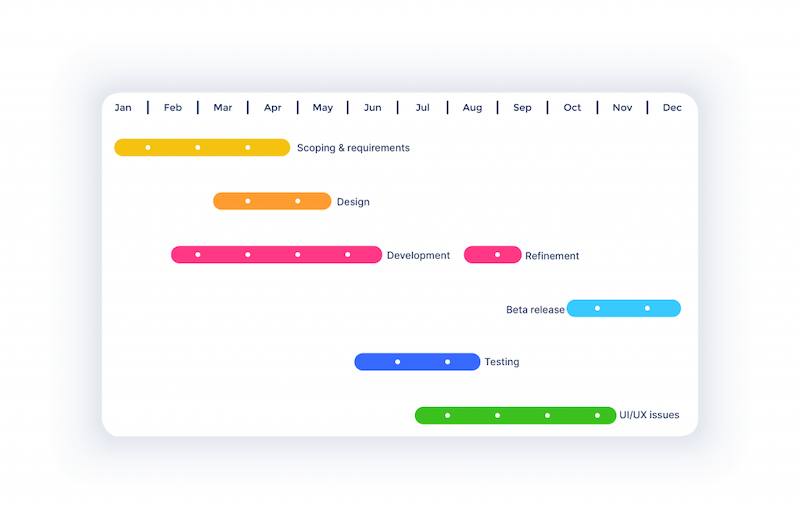
Gantt charts are bar charts providing a visual perspective to tasks that have been scheduled over time. They are used to plan projects of different sizes, and it helps to show the work that is scheduled for different days. Gantt charts also help users view the dates when a project is starting and ending in one chart. There are many things that you will see easily on a Gantt chart. Some of these are:
- The date when the project is starting,
- The tasks that will be completed during the project,
- The person working on individual tasks,
- Start and finish time for each task,
- The time to complete each task,
- How tasks are grouped, overlapping, and linked with each other,
- The date when the project will end.
The horizontal axis of Gantt charts stands for a time while the vertical axis represents the tasks. Therefore, the user will have to input the tasks, the starting dates, the ending dates, other dependencies, etc. As you do this, the bars will populate, representing the task durations. You will see this happen automatically if you are using Gantt chart software or other Gantt planning tools.
Contents
Using Gantt Charts for team collaboration
Team onboarding is effortless and straightforward with many of the project management tools online. You only need to invite your team members to the tool of your choice to start to boost project management in many ways. For example, Gantt charts make it easy to communicate deadlines clearly to teams of different functions.
Whatever tool you choose, a Gantt chart will help you communicate expectations to your team in a very efficient, clear way.
Gantt Chart tools
Here are some of the popular Gantt Chart tools and their most prominent features.
| Tool | What they’re best at |
| ProjectLibre Cloud | For MS Projects |
| GanttProject | For robust export |
| Agency | For small teams |
| OpenProject | For Mac or Linux users |
| Tom’s Planner | For freelancers or individuals |
| dotProject | For community support |
| Excel | For versatility |
Using Gantt Charts for software projects
Gantt Chart for waterfall projects
The logic behind Gantt charts naturally suits waterfall methodology better, because you need to know – at least roughly – what you’re going to implement to create a schedule. Therefore, you will likely come across Gantt charts in teams and organizations following the waterfall model.
Gantt Charts allow for mapping dependencies and subtasks across different phases of the project throughout the project’s life cycle. This tool is best for scheduling and planning in time. All tasks are on the timeline and the project manager can easily set milestones, link dependencies, manage resources, etc.

Gantt Chart for Agile projects
As for agile projects, Gantt charts are used to map more granular pieces of the development process. They can show the progress of sprints, facilitate communication with stakeholders, and track time.
A good use case for using Gantt charts for agile projects is when you have a large, complex project that requires several teams to work together. Even if they follow agile principles within the team, to coordinate all teams the project will probably need a hybrid approach. In this case, a Gantt chart can facilitate communication between teams and planning.
What is a product roadmap?
A roadmap is a visual summary that provides an overview of an upcoming product. Software teams and technology companies use roadmaps to plan and improve their products. They are helpful when launching a new product or making improvements to an existing one.
A roadmap is a planning tool that turns the product vision into actionable tasks for the product team. It helps with communication between the team and other stakeholders, who can consider strategic goals and progress.
The roadmap is based on the company strategy and includes high-level objectives and proposals. It also considers customer requirements and prioritizes their goals.
Developing the roadmap is a team effort, led by the Product Manager who ensures the agreed strategy is implemented with the dev team.
The roadmap needs to be flexible while addressing important points. These include the mission, which explains why the product should be developed and what problem it will solve. It’s also important to consider who the future customers and users will be, as well as the strategic and business goals. The roadmap should outline what needs to be built to achieve these goals.
Why are roadmaps popular tools in the product development process?
Roadmaps are popular tools in the product development process because they help with planning and implementing a product. This process is complex and requires a lot of effort. Success is dependent on commitment, alignment, and a sense of purpose across the organization. A roadmap can provide this help.
After strategic planning, when the basics of what needs to be delivered and when are established, the roadmap is created. It details the progression of achieving the objectives. The roadmap serves as the action plan for implementing the product strategy. By making the key steps transparent, roadmaps aid in achieving the objectives.
What is story mapping?

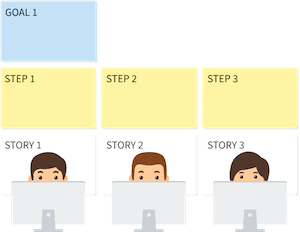
Creating user story maps is a visual exercise that helps development teams and product managers define a work that makes a delightful experience for users. This helps to improve the way the product team understands their customers and helps to prioritize work.
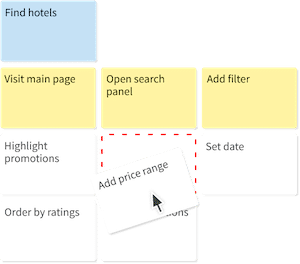
In story mapping, the team creates a dynamic outline of a user’s interaction with their product. This helps them evaluate the most beneficial steps to the user and prioritize the next thing to build or create. For agile organizations, this provides them with an alternative to creating to working from a lengthy document of requirements or creating a roll of backlog items.
In creating story maps, user stories are used to communicate the requirement based on user value. This will build and validate a shared understanding of what to do to develop the products users will love. Product teams write user stories in a way that captures the value of the business, and it will be finished within a sprint (development iteration).
Story mapping for software projects
Story mapping can facilitate the planning of both agile and waterfall projects. By framing the problem the software tries to solve from the user’s point of view, the primary goal of story mapping is to implement exactly – and only – what the user needs and will love to use. The idea behind story mapping is a more adaptive approach, as in many cases the developer and designer team discovers key usability aspects during implementation.
With that being said, we strongly believe that story mapping can deliver a lot of value for non-agile teams, as well. Simply following the natural narrative flow of the user journey while planning will help the entire team emphasize with the user and thus, create better, more user-friendly products.
What’s more, story mapping has other use cases and benefits, as well:

- iteration planning during the project,
- tracking development progress based on user journeys,
- communication with stakeholders with a visual tool,
- team onboarding,
- backlog management by connecting your story mapping tool to your issue tracker,
- prioritize features based on value to the user,
- planning releases and sprints.
Differentiating Story Maps And Gantt Charts
One of the most significant differences between the two tools is their use case. Gantt charts can be used by different people across different roles, such as project managers, team leaders, general managers, marketing managers, scheduling managers, operations managers, etc. It can also be used for collaboration across different teams such as project management teams, IT teams, marketing teams, manufacturing teams, product development teams, etc.
On the other hand, story maps are used mainly in software development, especially in by-product teams. Product teams may use both story maps and Gantt charts, but they will be used for different reasons. While the Gantt chart will ensure organization, planning, and tracking progress on projects or sprints, the goal of story maps is to determine software requirements, manage iterations, and fine-tune the backlog.
Conclusion
Gantt Charts, Roadmaps, and Story Maps are three of the most important tools for software development and project management. They each provide a way to visualize different aspects of the project to guide progress and make sure that all tasks are completed on time. While they can be used together in many projects, there are some key differences between them.
Gantt charts are a type of bar chart that illustrates the timeline of a project by displaying its various tasks as separate bars. This can make it easier to quickly identify which tasks need to be completed first and which ones have more urgent deadlines, allowing for better task coordination and easier timeline tracking.
Roadmaps are strategic planning documents that outline how an organization will reach its goals over time. They typically include high-level milestones such as launching a new product or reaching certain revenue targets. Roadmaps are useful for planning out the trajectory of a project.
Roadmaps and user story maps are both tools used in project management, but they have some key differences. Roadmaps provide a high-level overview of a project’s goals, timelines, and major milestones. They outline the strategic direction of a project and help stakeholders understand the overall vision and plan.
On the other hand, user story maps focus more on the user’s journey and experience. They break down the project into smaller, user-centered stories or tasks, and organize them in a timeline or visual format. User story maps help teams prioritize and plan their work based on user needs and feedback. While roadmaps provide a broader view, user story maps offer a more detailed, user-centric perspective on project development.
Handpicked articles for your story mapping journey
About the Author: Thomas Jackson is a professional freelance content writer at college paper writing service. He is an active member of several writing clubs in New York. He has written songs since he was a child. In addition, he gets inspiration from the live concerts he does in front of close friends and family members.
