In today’s fast-paced product environments, clarity and alignment are everything. A well-structured swimlane roadmap not only visualizes your team’s plans across time but also adds a second dimension—whether by theme, team, customer segment, or priority—to keep everyone on the same page.
In this post, we’ll explore creative grid-based structures for your swimlane roadmap, helping you leverage unlimited columns, custom swimlanes, and colorful card labels in StoriesOnBoard to communicate strategy clearly and drive execution.
What Is a Swimlane Product Roadmap?
A swimlane product roadmap is a timeline-based visualization divided into horizontal lanes (swimlanes), each representing a different category—such as team, feature theme, persona, or release train.
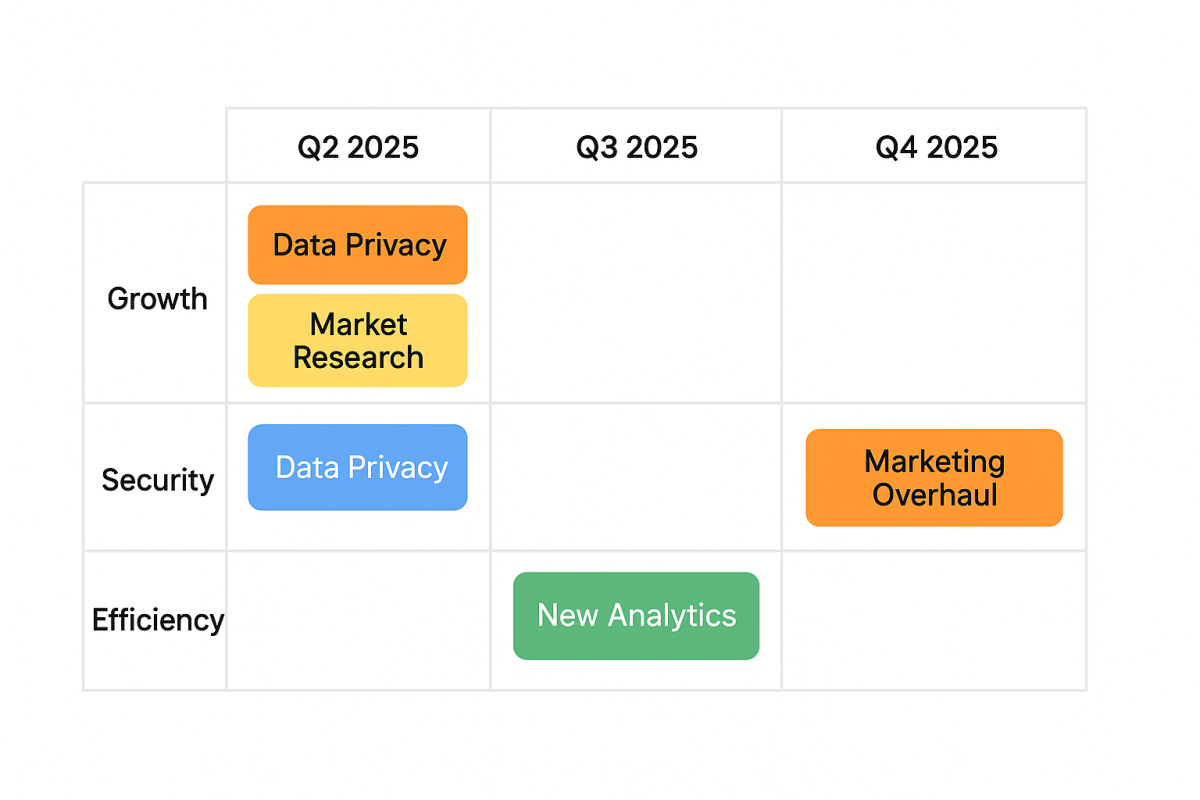
Columns represent periods or milestones (e.g., Q2 2025, “Alpha Release,” or “Backlog”), and cards within the lanes denote epics, releases, or individual features. By adding color-coded labels and unlimited customizable columns, you get a two-dimensional view of what’s planned, who’s responsible, and when each piece will be delivered.
8 Swimlane roadmap grid structure ideas
Below are eight grid structures to kickstart your next planning session. Each idea includes its purpose, benefit, when to use it, roadmap card contains, and example columns and example swimlanes.
1. Feature priority matrix
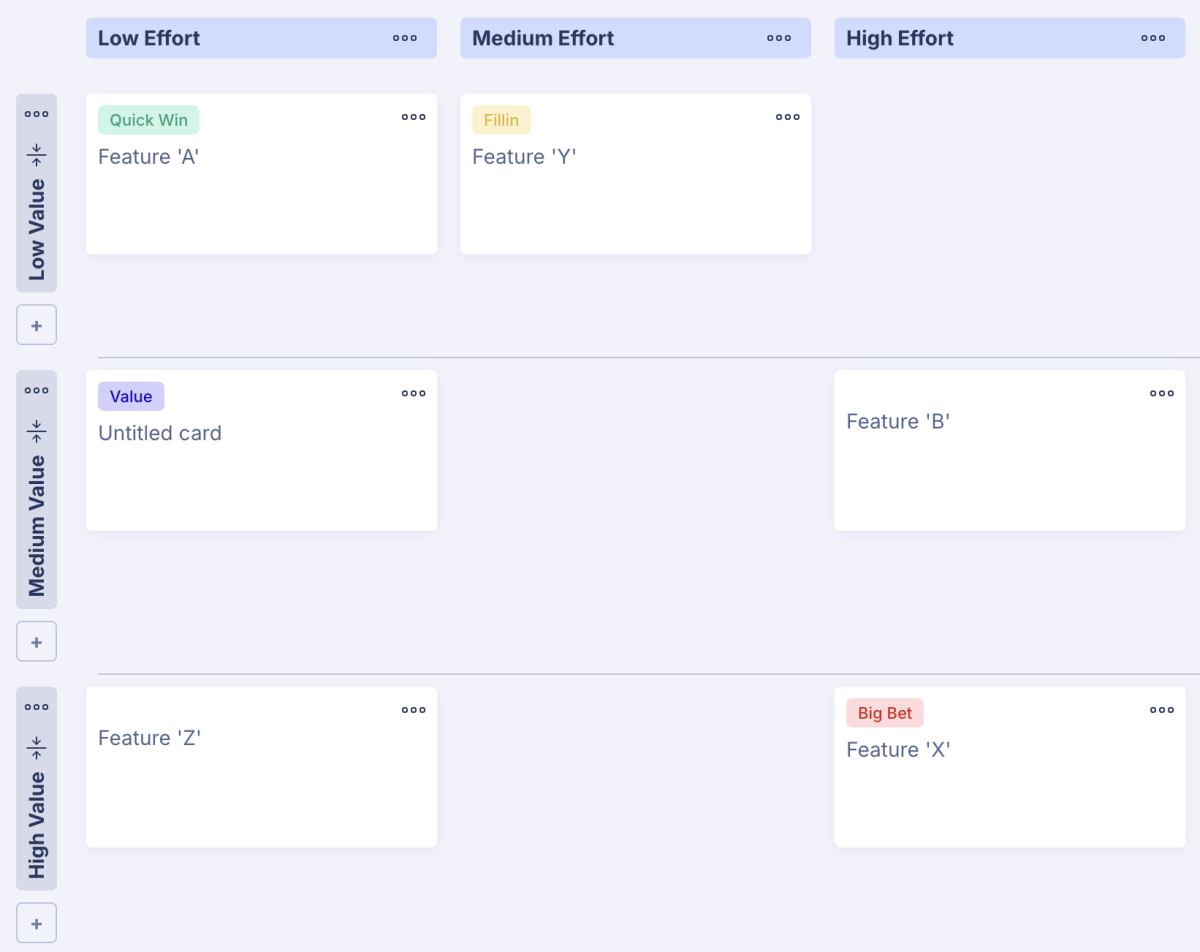
Kick off your planning by mapping every potential feature on an impact‑vs‑effort grid. This approach gives you a clear visual of quick wins versus major undertakings, empowering your team to prioritize high-value initiatives effectively. By evaluating features on both axes, you can drive stakeholder alignment and optimize resource allocation from the very start of your roadmap planning.
- Purpose: Balance impact vs. effort across features.
- Benefit: Quickly see which features deliver the most value for the least effort.
- When to Use It: Early in planning, when prioritizing a large backlog of epics.
- Roadmap Card Contains:
- Epic name
- Estimated effort (e.g., story points)
- Business value score
- Color label for priority quadrant (e.g., “Quick Win,” “Big Bet”)
- Example Columns: “Low Effort,” “Medium Effort,” “High Effort”
- Example Swimlanes: “Low Value,” “Medium Value,” “High Value”
2. Release Train Roadmap
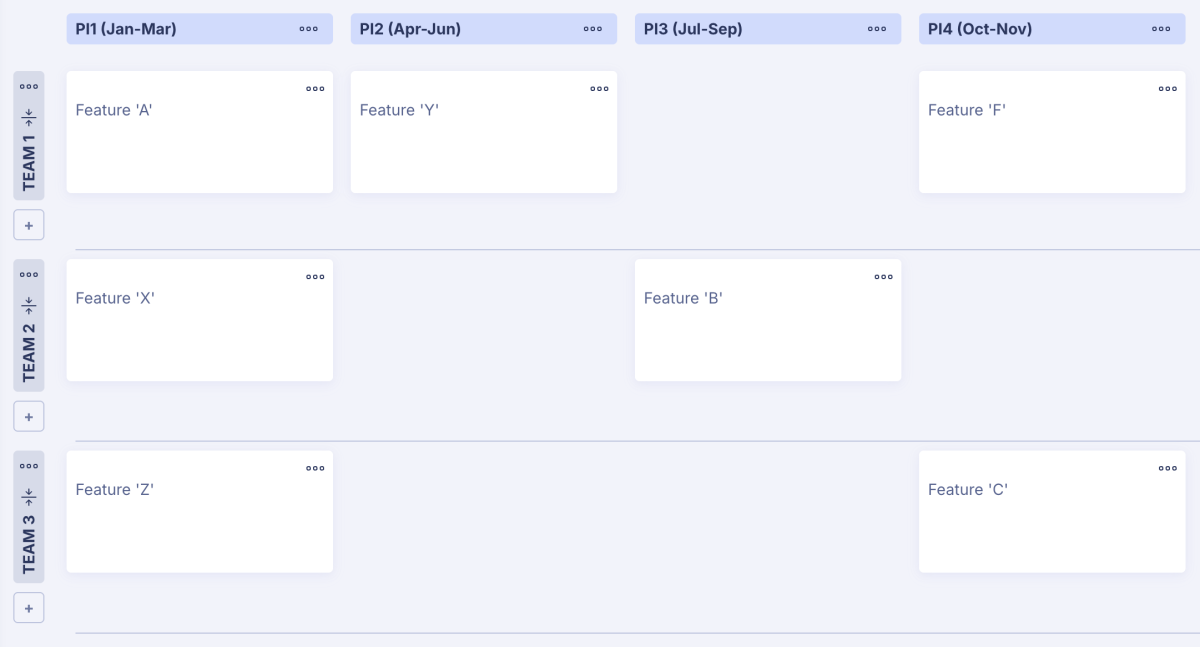
When multiple teams need to ride in sync, the Release Train layout keeps everyone on the same cadence, highlighting key objectives and dependencies across Program Increments. This structured timeline fosters transparency, so teams can anticipate handoffs and manage interdependencies proactively. By visualizing each ART’s milestones side by side, you’ll minimize delays and maintain steady delivery rhythms.
- Purpose: Coordinate multiple teams on synchronized release cadences.
- Benefit: Align cross-functional teams on a common timeline.
- When to Use It: For organizations adopting Agile Release Trains or Scaled Agile Framework (SAFe).
- Roadmap Card Contains:
- Release train/PI number
- Team or ART responsible
- Key objectives (OKRs)
- Color labels for risk level or status
- Example Columns: “PI1 (Jan–Mar),” “PI2 (Apr–Jun),” “PI3 (Jul–Sep)”
- Example Swimlanes: “Team A,” “Team B,” “Team C”
3. Customer-Journey Swimlanes
Align your product roadmap to each step of the user experience, ensuring you deliver capabilities exactly when customers need them most. By mapping features against journey stages—Awareness, Activation, Engagement, Retention—you can directly track how each initiative moves users along the funnel. This customer-centric view helps prioritize efforts that boost adoption, satisfaction, and long-term loyalty.
- Purpose: Showcase feature delivery mapped to stages in the user journey.
- Benefit: Ensure product enhancements target the right user phase.
- When to Use It: When optimizing onboarding, retention, or upsell flows.
- Roadmap Card Contains:
- Feature or epic aligned to a journey stage (e.g., “Welcome Tour”)
- Metric impact (e.g., +10% activation)
- Persona icon or label (e.g., “New User”)
- Example Columns: “Q3 2025,” “Q4 2025,” “Q1 2026”
- Example Swimlanes: “Awareness,” “Activation,” “Engagement,” “Retention”
4. Departmental Lanes
Give each functional area its own track—Engineering, Marketing, Support—so deliverables and ownership are crystal clear at a glance. This format fosters cross-functional visibility, ensuring that each department’s commitments, dependencies, and progress are front and center. The result? Improved accountability, faster decision-making, and smoother collaboration across teams.
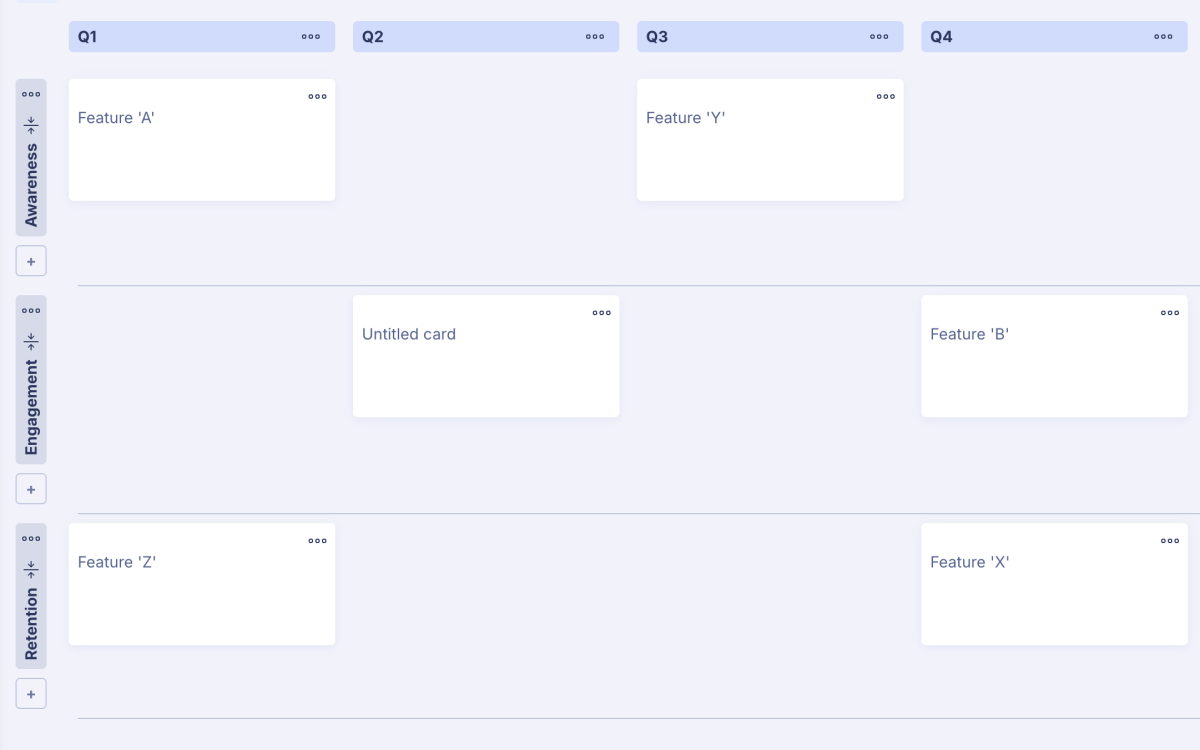
- Purpose: Give each department (e.g., Engineering, Marketing, Support) its own lane.
- Benefit: Clarifies responsibilities and fosters inter-departmental transparency.
- When to Use It: In cross-functional roadmapping workshops.
- Roadmap Card Contains:
- Department owner
- Deliverable title
- Dependencies (linked cards)
- Status label (e.g., “In Dev,” “Blocked”)
- Example Columns: “May 2025,” “June 2025,” “July 2025”
- Example Swimlanes: “Engineering,” “Marketing,” “Support”
5. Theme vs. Timeline Hybrid
Merge strategic themes with quarterly milestones to show not just when you’re shipping, but why it matters to your overarching vision. By layering thematic swimlanes—like Growth, Security, Efficiency—beneath your time-based columns, you maintain focus on long-term objectives while executing short-term plans. This hybrid approach brings cohesion to strategic and tactical planning, making it easy to communicate big-picture goals alongside delivery dates.
- Purpose: Balance long-term strategic themes with short-term timelines.
- Benefit: Maintains strategic focus while planning by quarter.
- When to Use It: When communicating both “what” and “when” to executives.
- Roadmap Card Contains:
- Strategic theme (e.g., “Data Privacy”)
- Quarter assigned
- Key results
- Color label for theme category
- Example Columns: “Q2 2025,” “Q3 2025,” “Q4 2025”
- Example Swimlanes: “Growth,” “Security,” “Efficiency”
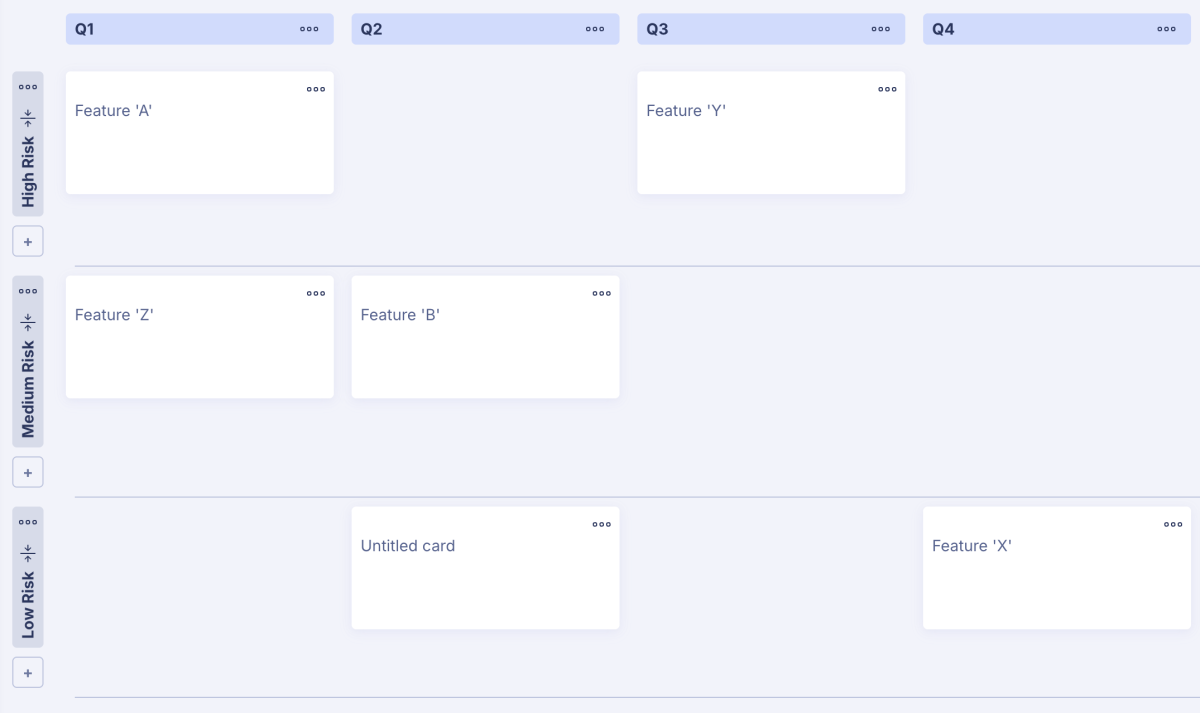
6. Risk and Compliance Swimlane
Surface any feature that requires a security audit or regulatory sign‑off alongside your broader plan to avoid last-minute surprises. This swimlane keeps compliance and risk assessments visible, so your team can integrate necessary checks early in the development cycle. By flagging high-risk items and tracking regulatory requirements, you reduce rework and ensure smoother approvals.
- Purpose: Highlight features requiring regulatory or security reviews.
- Benefit: Brings visibility to compliance work alongside product features.
- When to Use It: In heavily regulated industries (e.g., finance, healthcare).
- Roadmap Card Contains:
- Feature name
- Risk level (High/Med/Low)
- Compliance standard (e.g., GDPR, HIPAA)
- Color label matching risk
- Example Columns: “July 2025,” “Aug 2025,” “Sep 2025”
- Example Swimlanes: “High Risk,” “Medium Risk,” “Low Risk”
7. OKR-Aligned Roadmap
Tie every epic to a measurable company objective, so each tile on your roadmap directly contributes to the goals that matter most. This approach ensures that strategic priorities drive feature selection, creating direct accountability for outcomes. By tracking progress labels and key result targets, you’ll maintain focus on impact and adapt priorities dynamically.
- Purpose: Link roadmap items directly to quarterly objectives and key results.
- Benefit: Ensures every epic or release drives measurable goals.
- When to Use It: If your organization runs on OKRs.
- Roadmap Card Contains:
- Objective name
- Key result(s) targeted
- Success metric baseline & target
- Progress label (e.g., “10% Complete”)
- Example Columns: “Q2 2025,” “Q3 2025,” “Q4 2025”
- Example Swimlanes: “Objective 1: Increase Activation,” “Objective 2: Reduce Churn”
8. Market Segment Prioritization
Group epics by customer segment—SMB, Mid-Market, Enterprise—so you can tailor releases to the needs and revenue potential of each audience. This layout helps you visualize which segments will benefit from upcoming features, guiding go-to-market strategies and resource planning. By aligning product investments with segment-specific goals, you’ll maximize adoption and monetization opportunities.
- Purpose: Tailor features by customer segment (e.g., SMB, Enterprise).
- Benefit: Clearly shows which segments benefit from upcoming releases.
- When to Use It: When serving distinct markets with different needs.
- Roadmap Card Contains:
- Feature or epic
- Target segment icon or label
- Expected revenue impact
- Priority label
- Example Columns: “Release 1,” “Release 2,” “Release 3”
- Example Swimlanes: “SMB,” “Mid-Market,” “Enterprise”
Wrapping up
Whether you’re highlighting quick wins in a Feature Priority Matrix, syncing multiple Agile Release Trains, or tailoring your roadmap by customer segment, each grid layout offers a unique lens for viewing priorities and communicating across teams.
As you implement these ideas in StoriesOnBoard:
- Experiment Freely: Don’t hesitate to tweak column names, swimlane groupings, or card fields to suit your context. Use colored text labels to flag risks, progress, or ownership.
- Iterate Quickly: Roadmaps are living documents. Schedule regular check‑ins—monthly or quarterly—to update statuses, shift priorities, and retire completed items.
- Tell the Story: Complement your grid with narrative context. In blog posts, presentations, or team demos, walk your audience through the why, what, and when of each swimlane.
Ready to bring your swimlane roadmap to life? Fire up StoriesOnBoard, apply one of these structures, and snap a screenshot for your next blog post or stakeholder presentation. Here’s to more transparent planning, smarter prioritization, and smoother execution across your product journey!
